
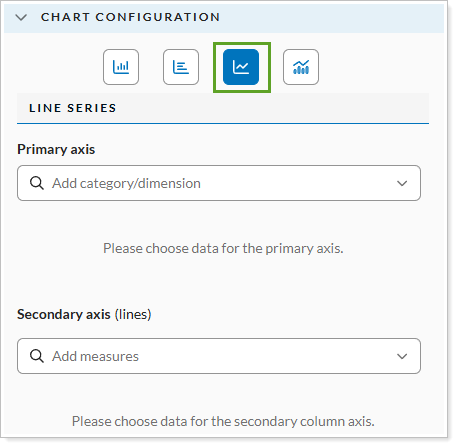
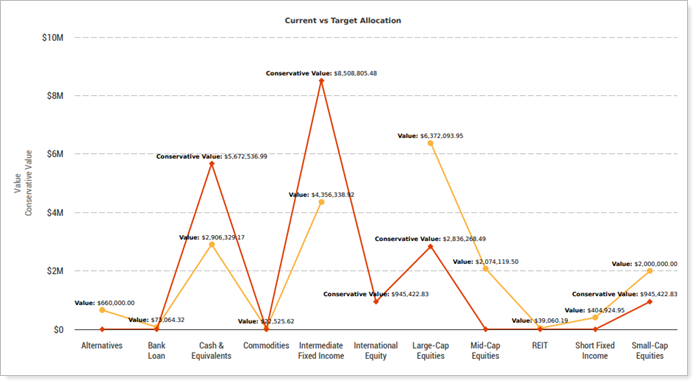
In Report Studio, a line series shows related data values as connected points along a continuous line on a chart. Use it to visualize trends, performance, or change over time.
For more information, see Introduction to Report Studio.